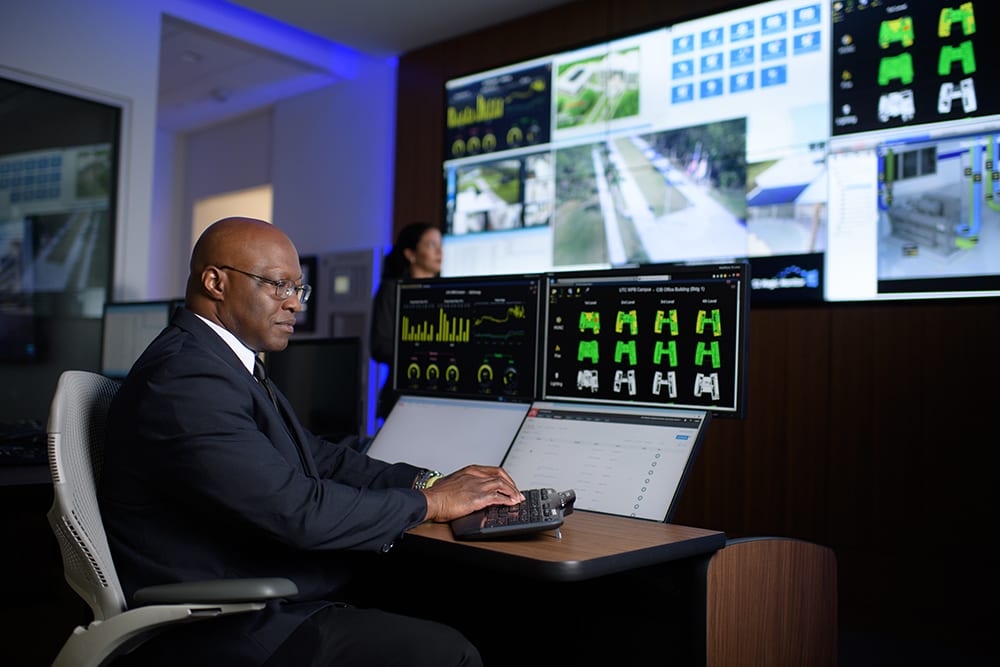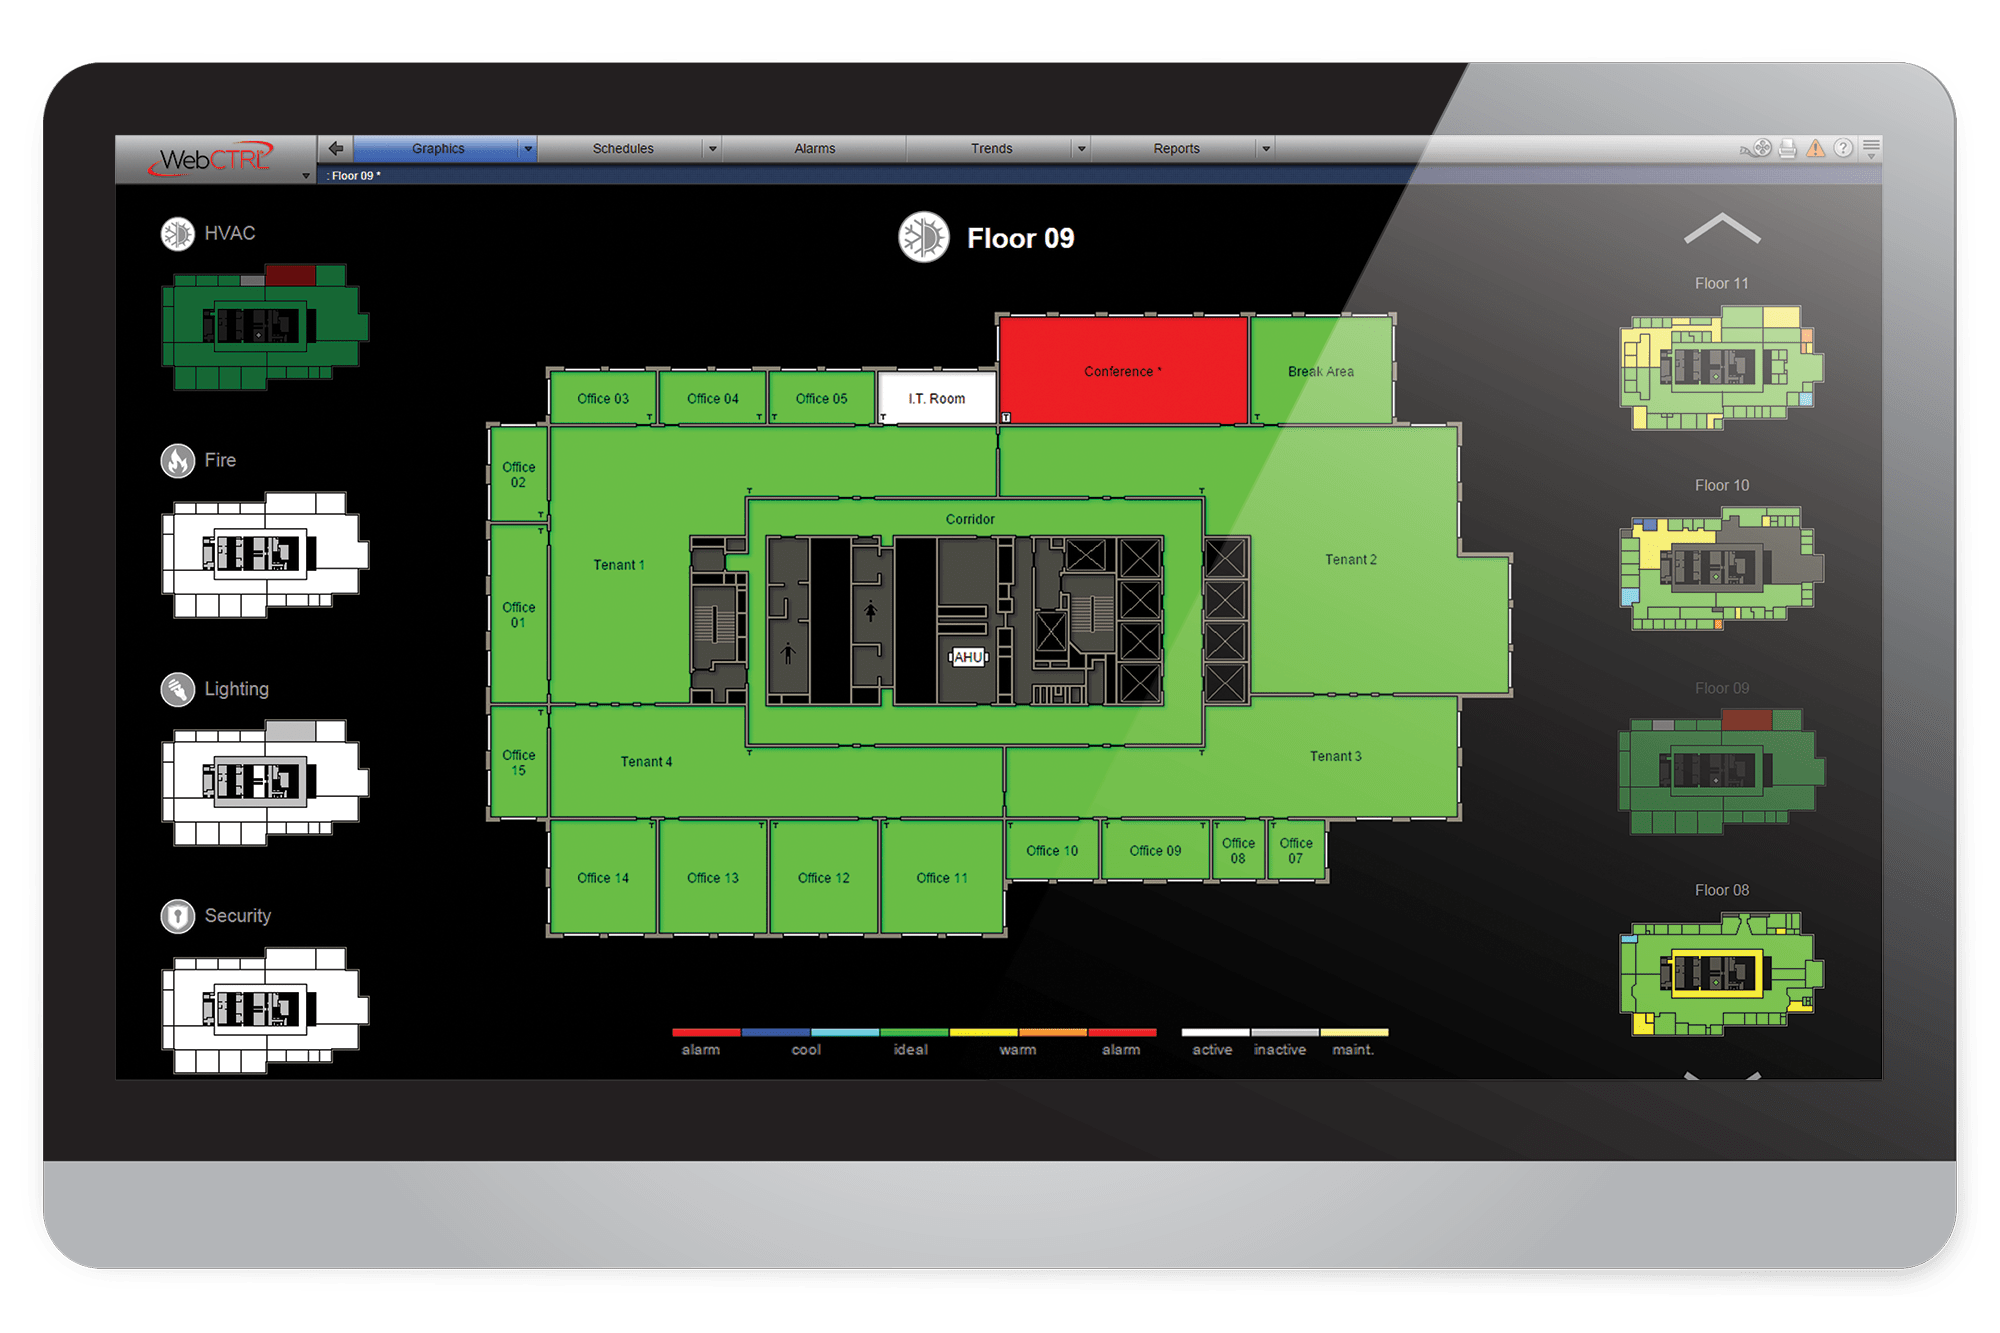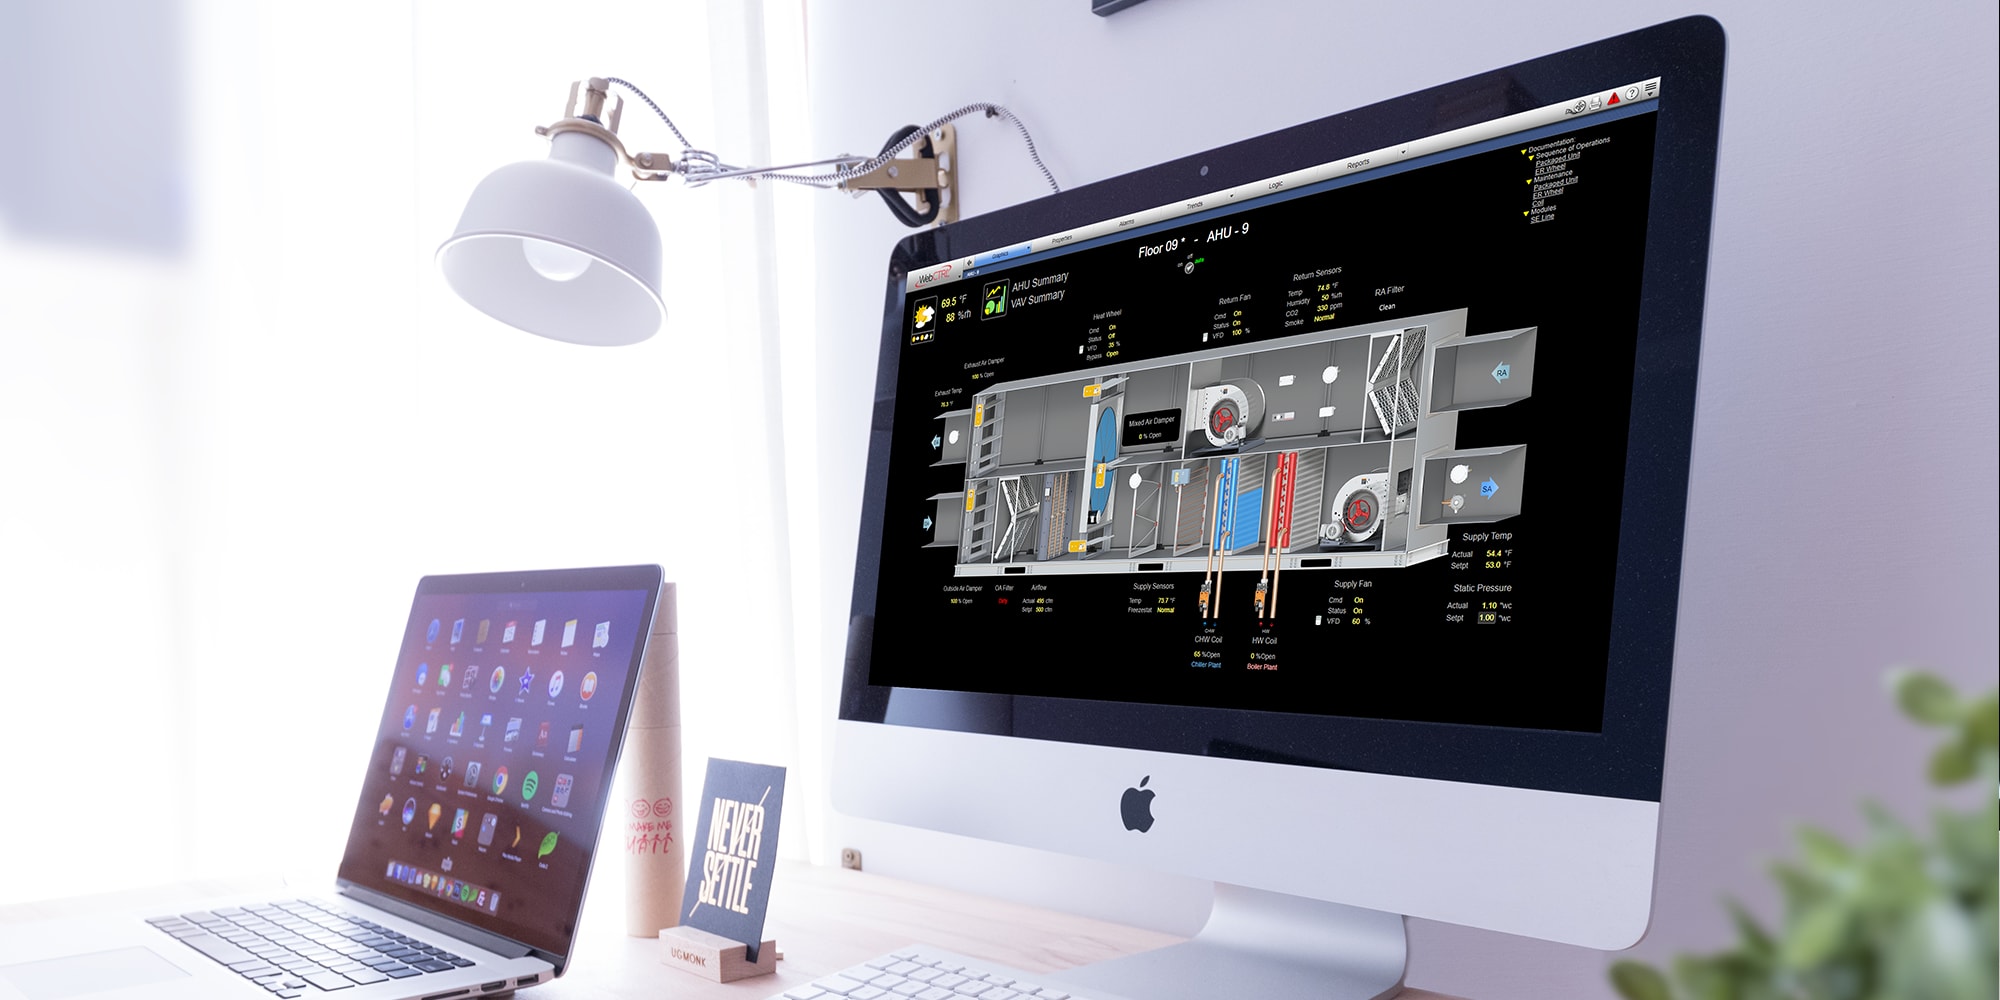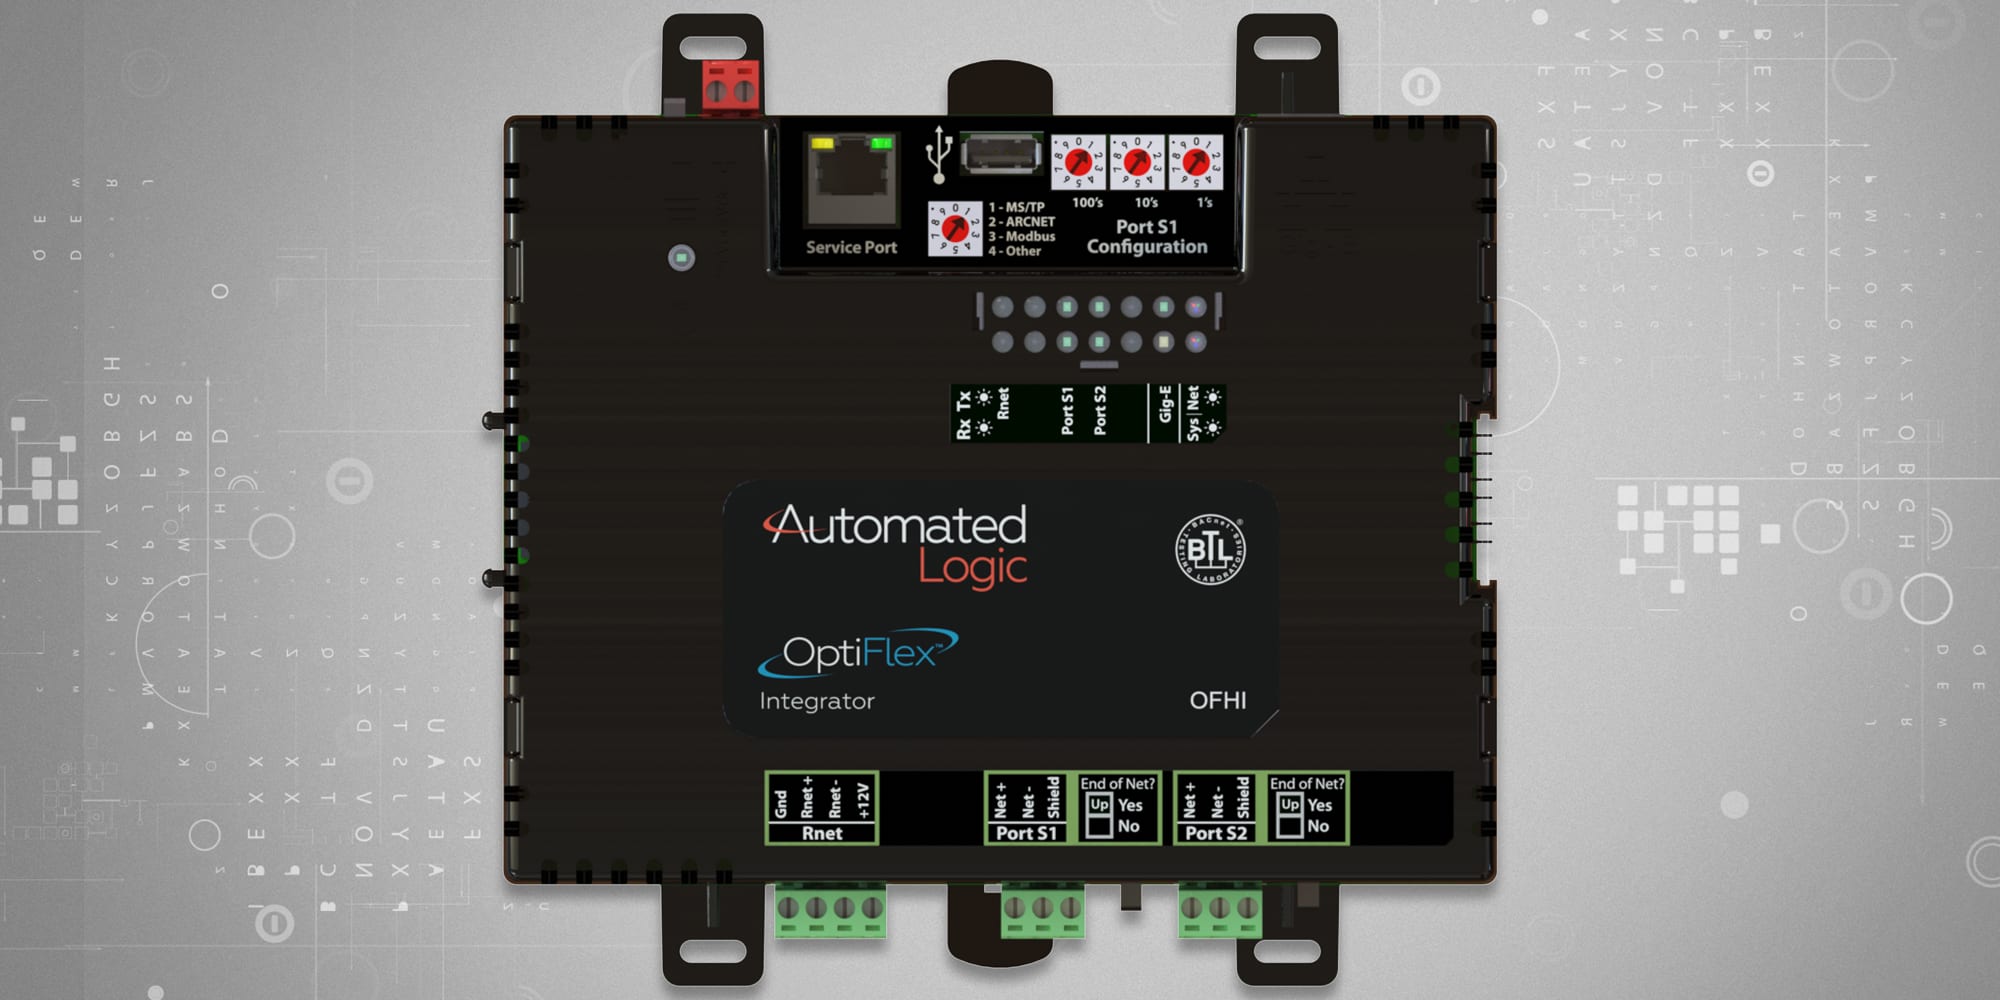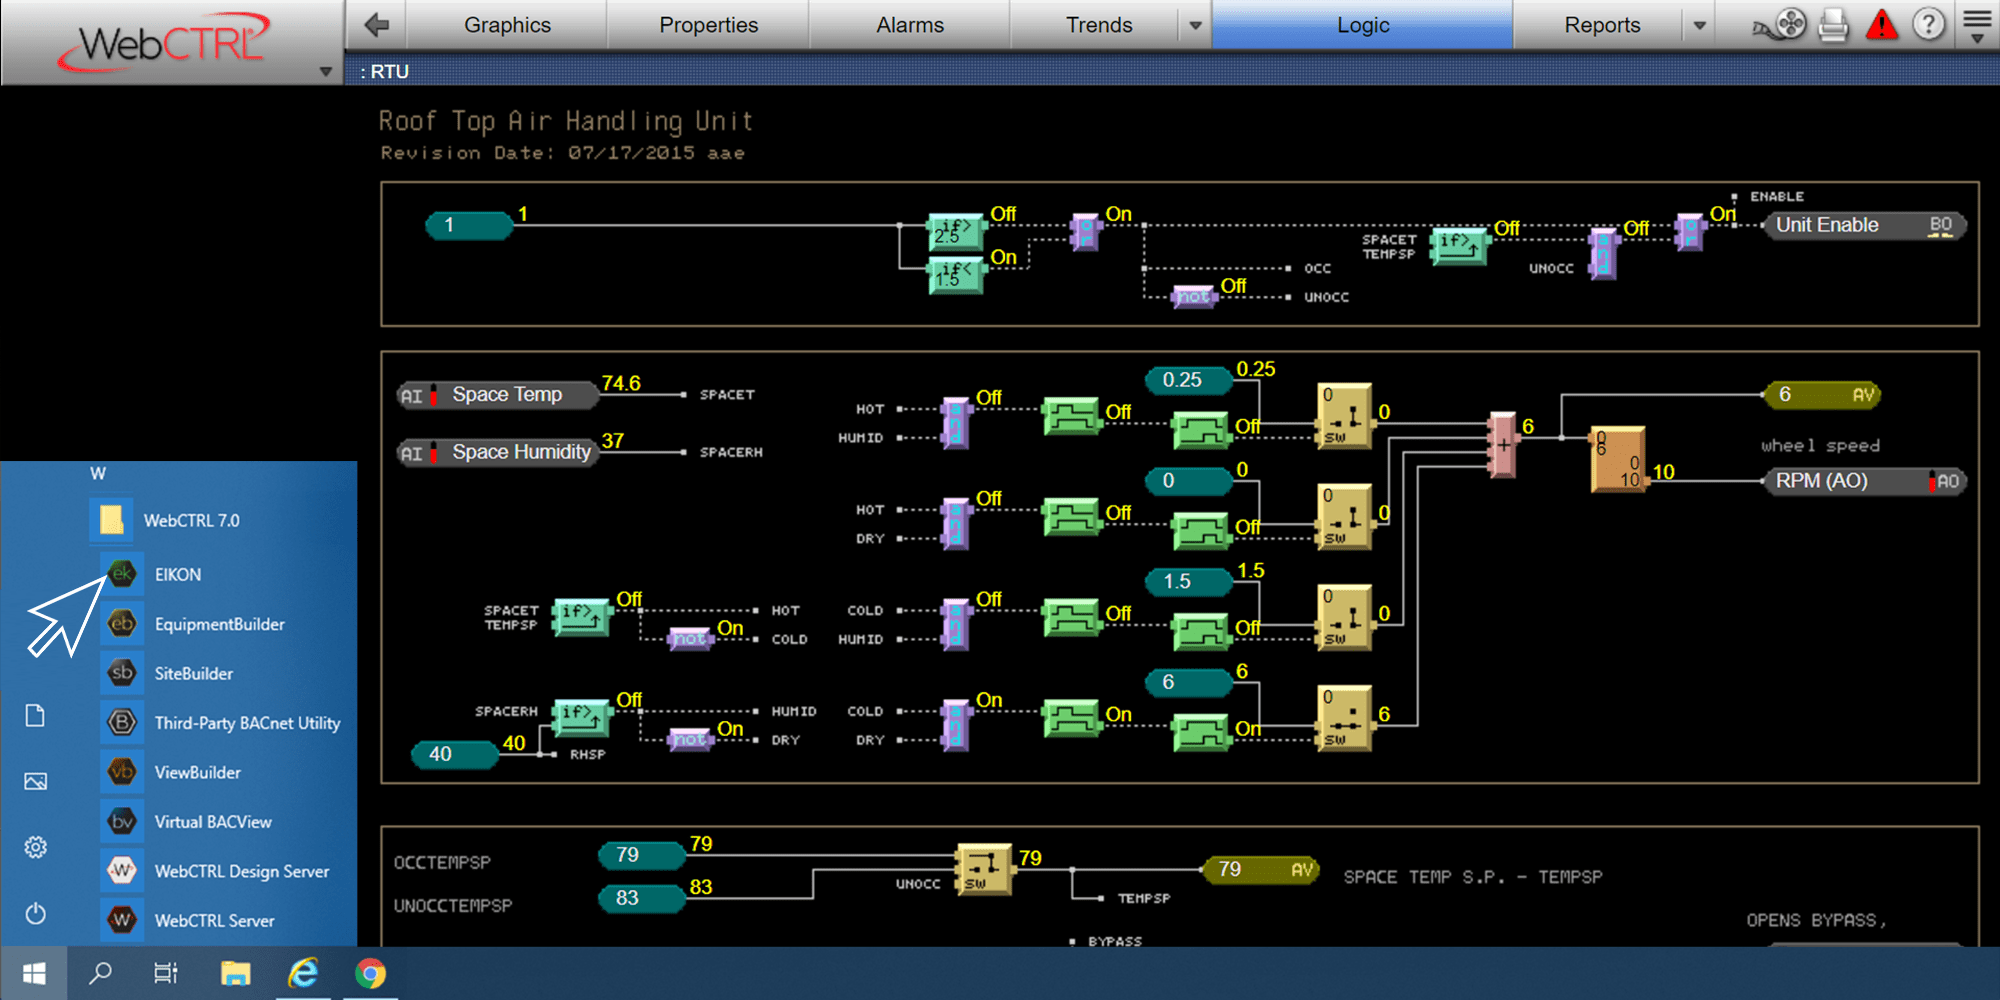

The WebCTRL building automation system is a powerful web-based platform that provides facility managers with software tools to keep occupants comfortable, manage energy conservation measures, identify key operational problems, and analyze the results.
WHICH WEBCTRL IS RIGHT FOR YOU? YOU CHOOSE! | ||
|---|---|---|
 |
 |
|
integration_instructionsPLATFORM |
On-Premise |
Cloud |
constructionSET-UP |
You purchase the server hardware and software, and our Automated Logic Branch or Dealer installs and configures the software on-site | The Automated Logic Factory pre-installs and configures the software on our cloud server |
monetization_onCOST |
CapEx Model: The server hardware and software license costs are paid up-front | OpEx Model: Sold as a subscription service with no up-front server & software costs |
aspect_ratioSCALABILITY |
May require additional server hardware and software be installed on-site, depending on application | Pay for what you use and easily scale to meet requirements |
gpp_goodSECURITY |
Third Party VPN recommended for server-to-network encryption | BACnet Secure Connect (TLS v1.3) and/or a VPN tunnel used for server-to-network encryption |
call_mergeINTEGRATION |
May require additional integration hardware and/or software | Library of APIs readily available |
storageIT SUPPORT |
Software maintenance, server uptime, and database backups are managed by your IT team | Software maintenance, server uptime, and database backups are managed by the Automated Logic Factory |
support_agentCUSTOMER SUPPORT |
Local Automated Logic Branch or Dealer | The Automated Logic Factory provides direct customer onboarding, while the Automated Logic Branch or Dealer provides local support |
insert_drive_fileSPEC SHEET |
file_download Download | file_download Download |


